I thought it might be interesting to look at what people are talking about at #evol2012 versus what they were talking about at #asm2012. I pulled down all the tweets from both meetings (using their respective hashtags), split the tweets into words, did some high tech data filtering – de-capitalized, junked the punctuation, and removed all tweets with both “RT” and “@” – and dumped the words into a file.
This resulted in a bunch of “whats” and “my” and “there”, so to get rid of all the boring bits, and to give props to the #evol2012 host country, I pulled down a few thousand #Canada tweets, did the same, and cross-referenced the three lists of words. I did all this with the excellent twitteR package in R.
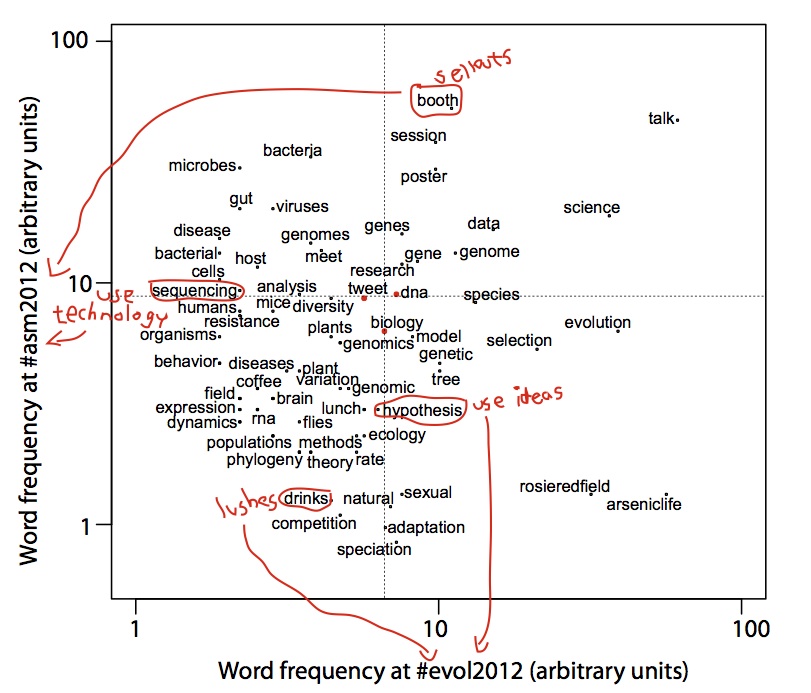
I normalized everything by total word numbers, and plotted it.
Results below.